Java Flow Profiler (Jflop)
Installation
The Jflop distribution package contains two jar files:
-
jflop-agent.jar - java agent that should be used when you start your application server.
-
jflop-jconsole-plugin.jar - Jflop UI packaged as Java Console plugin.
To make your application server use Jflop profiler you have to:
-
Add to the server start command line the following option:
-javaagent:jflop-agent.jar
-
Make sure the JMX port is opened so that JConsole could connect to the server.
The relevant system properties can be set on the server command line like this:
            -Dcom.sun.management.jmxremote.port=2099 -Dcom.sun.management.jmxremote.authenticate=false
            -Dcom.sun.management.jmxremote.ssl=false
To run Jflop UI, run the JConsole with the Jflop plugin. For example, on Windows the command line will look like this:
"%JAVA_HOME%\bin\jconsole" -pluginpath jflop-jconsole-plugin.jar
After JConsole starts, connect to your server process in regular way. If everything is OK you will see the Jflop tab
in the JConsole.
UI controls
The Jflop tab in the JConsole looks like this:
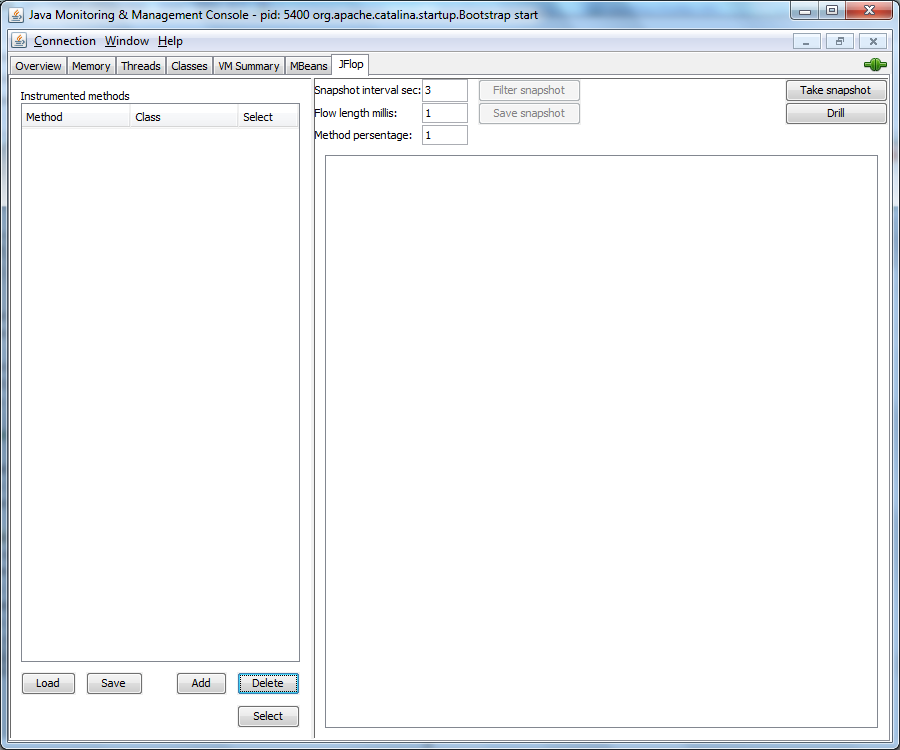
The UI has two panels:
- The left panel allows to add and remove the instrumented methods, and save the method list to and load it from a
file.
- The right panel allows to set the snapshot parameters and take snapshots.
Defining the instrumented methods
The instrumented methods are those for which Jflop collects the performance statistics.
To add an instrumented method, press the Add button at the bottom of the left panel. You will see a window which presents
the classes loaded in the server JVM. Browse through the class hierarchy and choose the methods to instrument.
You can select multiple methods at a time. Note that only the implemented methods can be selected, and this view does not
present abstract or interface methods.
To delete an instrumented method check the Select checkbox in the instrumented methods table and click the Delete button.
To save the configuration to a file or to load it from a file use the Save
and Load buttons. The format of the configuration file is Java properties.
Configuring and taking snapshots
Once you have defined the instrumented methods, you can take performance snapshots.
There are three configuration parameters:
-
Snapshot interval sec:
The time interval in seconds during which the performance data is recorded.
-
Flow length millis:
The minimal length of a flow in milliseconds. The flows which are shorter than this threshold will not be presented
in the snapshot. This option is useful when you take a snapshot of a load with lot of different flows, and wish
to focus only on the heavy ones.
-
Method percentage:
The percent of the method cumulative time in the flow cumulative time. The methods with the percentage less than
this threshold will not be presented in the the snapshot. This option is useful when your flow becomes complex,
and you want to focus on the heavy methods.
To take a snapshot press the Take snapshot button. You have to make sure that your system is under some load during the snapshot
interval, otherwise nothing will be recorded.
After the interval ends, Jflop presents the recorded flows in the text format in the snapshot panel.
Each flow has flow-level statistics, and method-level statistics for the instrumented methods involved in that flow.
The percents in the left column represent the percentage of the method cumulative time in the flow cumulative time.

After the snapshot is taken you can filter it by changing the Flow length and Method percentage fields and pressing the
Filter snapshot button.
You can also save the snapshot in a text file by pressing the Save snapshot button.
Automatic drill down mode
If some of you services doesn't perform as expected, and you don't understand why, finding the bottleneck can be challenging.
Suppose you have already instrumented the suspicious methods, but still can't find the performance leak. This is the case when the
automatic drill down mode becomes helpful.
In the drill down mode Jflop iteratively takes a snapshot, analyzes it, adjusts the list of instrumented methods, and takes a snapshot again.
On the snapshot analysis phase Jflop removes the instrumentation from unsignificant methods, and adds instrumentation
to the methods called from the most significant methods in the snapshot.
The process stops when all the significant methods in the flow are the instrumented, and the method list cannot be adjusted anymore.
When you use the drill down mode it's important that your server is under a stable load. If the load changes from one iteration to another,
the snapshot analysis may bring conflicting results. I recommend to use
JMeter with
a constant throughput timer to create a stable load.
Another recommendation would be keeping the load as narrow as possible so that your snapshots will contain a single flow,
and use a single client thread to avoid concurrency-related disturbances.
Copyright © 2010 Artem Spector